Angular 6 has a the new feature to create multiple projects in one workspace with applications and libraries is one workspace. But the problem is the debugging of these projects in visual code.
Preperation
In my example I create one root application demo-debug-app, a library demo-debug-lib and a sub application demo-debug-app2.
ng new demo-debug-app
ng generate library demo-debug-lib --prefix=lib
ng generate application demo-debug-app2
As debugger I use Visual Studio Code and the extension Debugger for Chrome.
Root Application Debugging
To debug the root application you start the application with:
ng serve
and the start the debugger with the configuration in the launch.json
{
    "type": "chrome",
    "request": "launch",
    "name": "Launch demo-debug-app",
    "url": "http://localhost:4200",
    "webRoot": "${workspaceFolder}"
}
Project Application Debugging
If you want to debug an application in the projects folder. You first need to start this application with the addition parameter project
ng serve demo-debug-app2
But if you try to set a breakpoint in this application the breakpoint did not match.
You need to update or create a new debugging configuration in launch.json whith the a correct webRoot, so the debugger knows where to find the sourcen.
{
    "type": "chrome",
    "request": "launch",
    "name": "Launch demo-debug-app2",
    "url": "http://localhost:4200",
    "webRoot": "${workspaceFolder}/projects/demo-debug-app2"
}
Debugging Libraries
For a library you need a host application this could be a test application or the application whitch needs this library, but in both cases you cannot start the application direcly, you need to start the host application, but then you cannot debug into the library.
The problem is that this library is handeled like any other library you use and is packaged as part of the vendor.js file, normaly for this file no map files are published when you use ng serve. In the Chrome Debugger only the javascript files exists, and can be debugged.
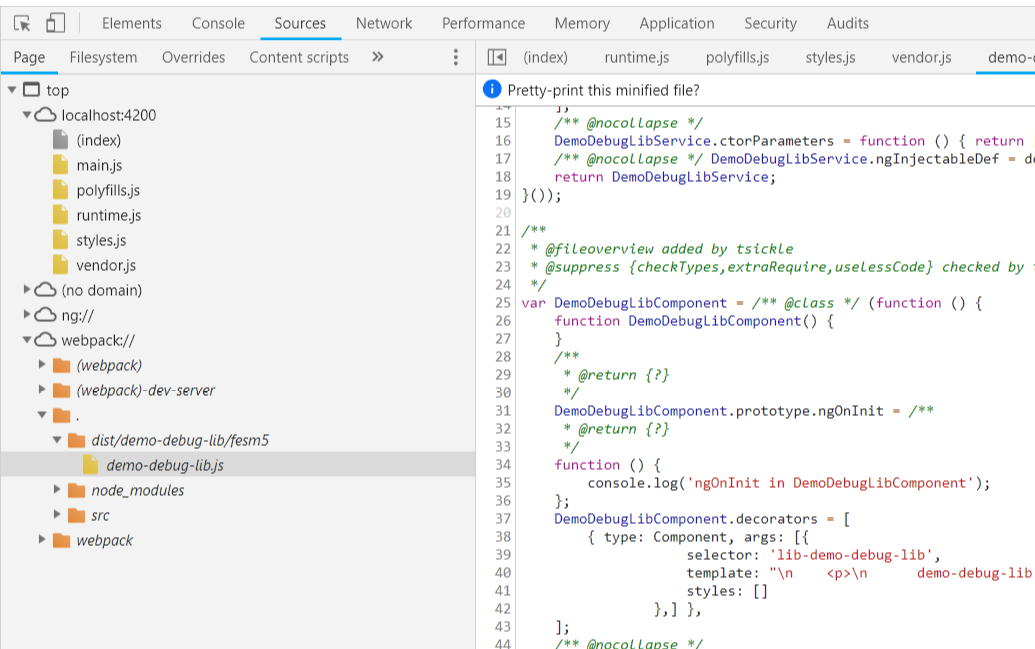
But with a new feature in Angular 6.1 --vendorSourceMap the ng serve can publish all vendor map files, too.
ng serve --vendorSourceMap
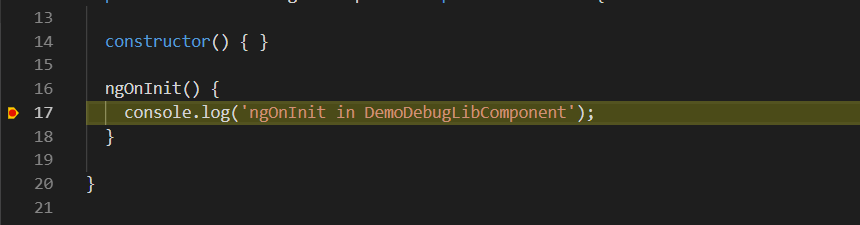
And now Google Chrome shows the type scripts files
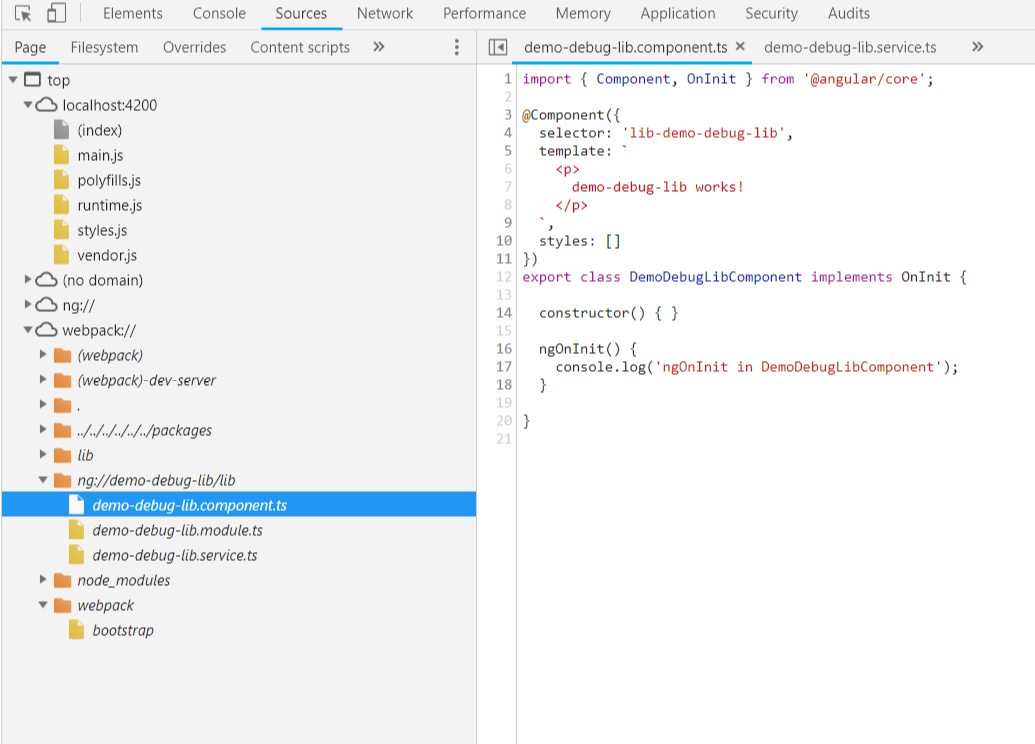
But the the Visual Studio Code debugger did not work, because it can not map the "ng://demo-debug-lib/lib" folder to any source code. To do this we need to update the launch.json file and add the the sourceMapPathOverrides property with the mapping where to find the source code.
{
    "type": "chrome",
    "request": "launch",
    "name": "Launch demo-debug-app",
    "url": "http://localhost:4200",
    "webRoot": "${workspaceFolder}",
    "sourceMapPathOverrides": {
        "webpack:///ng://demo-debug-lib/lib/*": "${workspaceFolder}/projects/src/lib/*"
    },
},
And now it works fine.
For project application project you need to do the same but start the server with the project name and add the sourceMapPathOverrides
ng serve demo-debug-app2 --vendorSourceMap
{
    "type": "chrome",
    "request": "launch",
    "name": "Launch demo-debug-app2",
    "url": "http://localhost:4200",
    "webRoot": "${workspaceFolder}/projects/demo-debug-app2",
    "sourceMapPathOverrides": {
        "webpack:///ng://demo-debug-lib/lib/*": "${workspaceFolder}/projects/src/lib/*"
    },
}