How to use D3.js for Server Side Chart Generation in .NET
Part 1: Creating a Donut Chart using D3.js
Part 2: Render/Export D3.js Chart as PNG Image using PhantomJS
Part 3: Creating a simple REST Service using ASP.NET Web API
So after we have created a HTML Template of our Donut Chart in the previous part, I will be dealing with exporting of this Chart as a PNG Image in this part of the Series.
For that purpose we will be using PhantomJS. It is a headless webkit engine that can be scriptable with Javascript and has native support for DOM, CSS and SVG. I have chosen the PhantomJS over other engines because it is really easy to use, supports various exports (PNG, PDF etc.) out of the box and its implementation of DOM is definitely better then using JSDom under Node.js/IO.js … at least this is my personal opinion.
One more thing that I like about PhantomJS is that is one single .exe file. This means you don’t have to install anything so it is portable and you can simply put him in the same folder as your HTML Template.
Now we need to script the PhantomJS to do what we want. We need to create new Javascript fille called render.js that will contain our rendering logic shown in the Code Snippet:
var page = require('webpage').create(),
fs = require('fs'),
system = require('system'),
address, output;
if (system.args.length < 3 || system.args.length > 3)
{
console.log('Usage: render.js htmlFileName pngFileName');
phantom.exit(1);
}
else
{
address = 'file:///' + fs.absolute(system.args[1]);
output = system.args[2];
page.open(address, function (status) {
if (status !== 'success') {
console.log('Unable to load the address: ' + address);
phantom.exit(1);
} else {
window.setTimeout(function () {
page.render(output);
phantom.exit();
}, 200);
}
});
}
As you can see, first we are including Webpage, File System and System Module from PhantomJS API. Webpage is needed for loading and rendering of our HTML Chart Template, File System gives us access to local file system for reading and writing the files and System Module is there only for accessing the command arguments on start of the PhantomJS.
Next thing is to check if the PhantomJS is started with enough arguments, and if everything is fine, we are proceeding to the main part of the script which is nothing more then loading the given HTML file in Webpage Module and calling the Render() method to the given output file. Depending of which file extension has been given to Render() method (PNG, PDF, JPEG or GIF), it will deliver the correct output format of the file.
Now when everything is in the same folder, we can simply start PhantomJS with following command:
C:\Temp\Chart> phantomjs.exe render.js donut.html donut.png
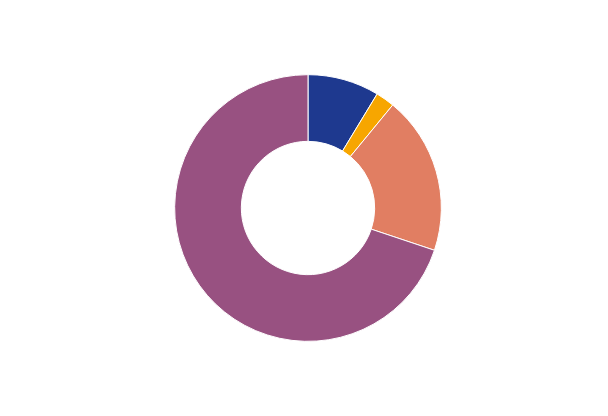
As a result, you should find your Donut Chart as PNG file written on the File System looking something like this:

Posted
Jul 22 2015, 01:56 PM
by
Armin Kalajdzija