One of really powerful features of Azure Machine Learning platform ability to probe multiple learning models in very short time. Typically in machine learning we spent lot of time (months or even years) to implement and test (probe) different learning algorithms. These algorithms are called train models in context of Azure ML.
First of all you have to know which type of algorithms you should chose. Right now, there are few different groups:
1. Anomaly Detection
2. Classification
3. Clustering
4. Regression
In my example I will use following dataset.
a,b,c,outa+b-c
21,14,2,1,37
11,14,2,1,27
1,1,1,0,3
33,21,22,1,76
33,20,20,0,73
2,14,2,1,18
3,6,3,0,12
4,5,4,0,13
4,5,5,0,14
21,5,2,1,28
4,14,1,1,19
There are 3 input variables (features) and one output variable ‘out’. The variable ‘a+b+c’ is not used in experiment. It represents a sum of variables a, b and c. Let’s call it x, where
x = a + b + c
out is calculated as :
f: out = int(mod(x,10), 5)
It means that our result is (look in the data source) 0 or 1. For this reason we should use some binary classificatory module to train the model.
This function operates on three input variables, it generates a sum and then perform modulus operation.
To simplify the problem following numbers might help:
1-4 =>0
5-9 =>1
10-14=>0
15-19=>1
. . .
When you see this, it is very easy for us humans to guess the result for any number. For example 123654 would be 0. But, difficulty in this problem is to figure out dependencies between numbers as shown above in original data source.
My intension is to try if Azure ML can help to solve such problems.I first took Two-Class Decision Jungle module and enter some parameters. My goal was to find module which which can guess my function f.and approximate best function g which aligns as much as possible to f. Typically function f is assumed but not known.
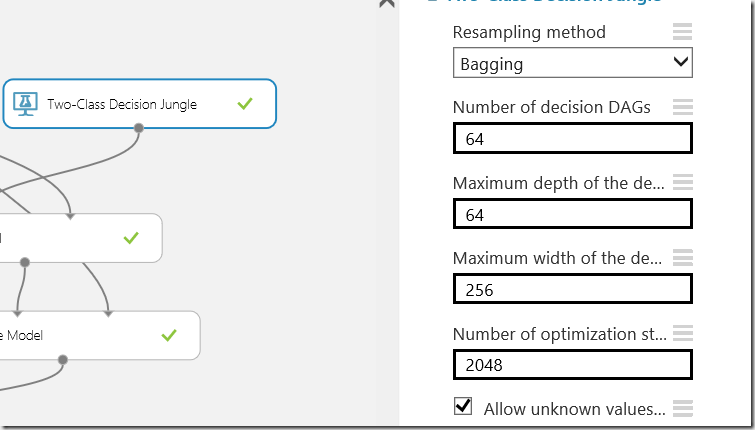
I tried various parameter settings (Number of decision DAGs, Max depth,..) to find out the best solution.
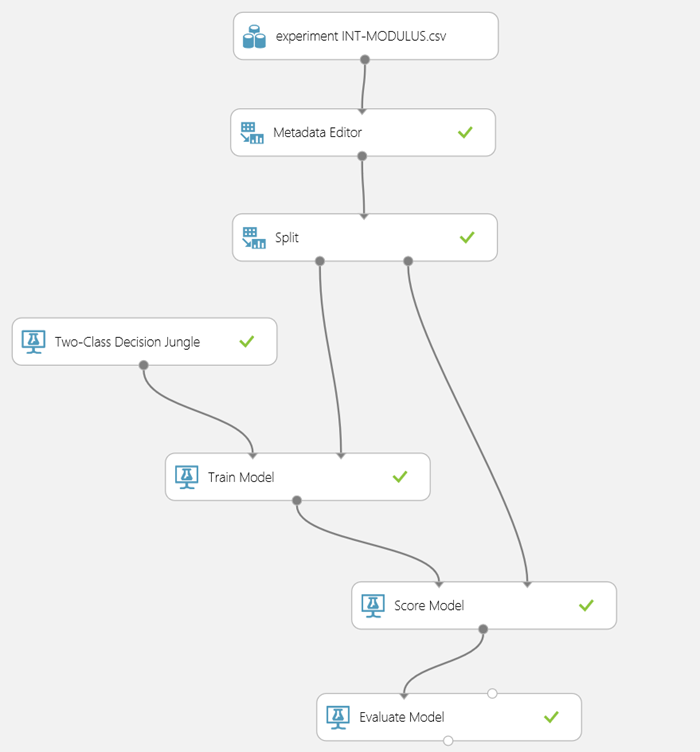
This is my experiment:
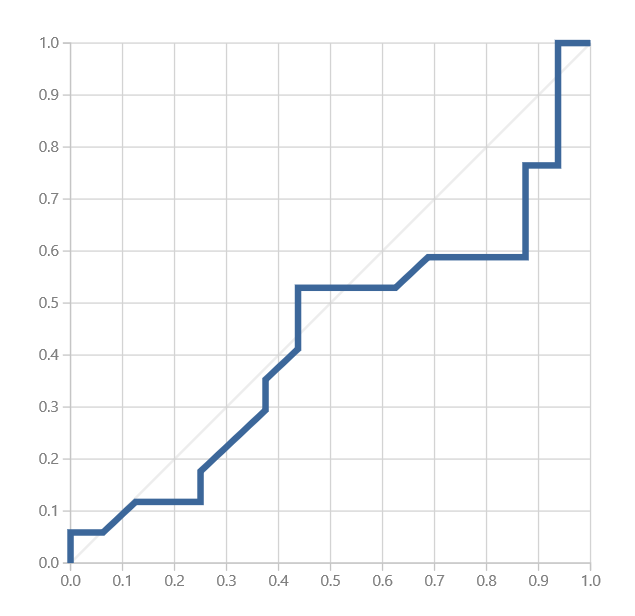
Unfortunately the result was not that good. I used the ROC diagram (shown in red on diagrams in next topic) of Evaluate module. As you see the model is very, very bad. In other words, it is unusual.
Two-Class Bayes Point Machine
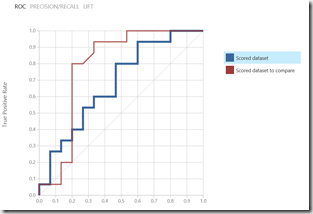
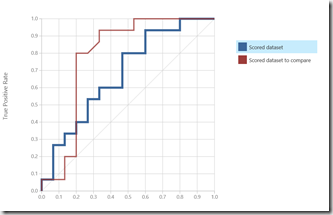
So, I thought this model is not the best one and wanted to try another one. My choice was now Two-Class Bayes Point Machine. Now I added additional train module and wanted to compare it with original jungle module. Here is the result with various parameters
590 Iterations 1200 Iterations
As you see in red is “Jungle” from previous experiment, but a bit more optimized. In blue is result for Two-Class Bayes Point Machine. It looks like “Jungle” module would better perform (Curve is converging to the top-left corner.
Two class boosted decision tree
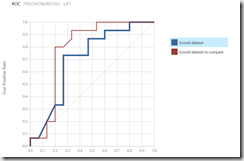
Now, I simple peeked the next module in the list Two-Class Boosted Decision Tree. But before I removed from experiment the module Two-Class Bayes Point Machine . Now I added to experiment the module Two-Class Boosted Decision Tree to compare it with “Jungle” module. Following pictures show Evaluation Result of comparison of these two modules. In blue is Two-Class Boosted Decision Tree. Numbers below pictures show parameters of the module in order as they appear in experiment.
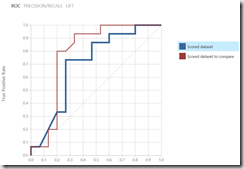
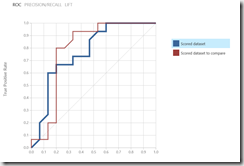
300, 10, 0.2, 10 900,10,02,500 1500, 10, 0.2, 1500
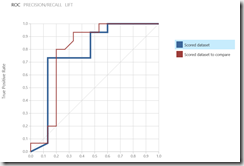
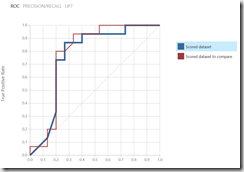
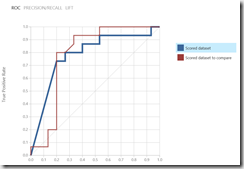
3000, 10, 0.2, 3000 3000, 0.3, 3000 3000, 0.5, 3000
After I was not satisfied with result, I doubled the dataset, by using same data twice, rerun experiment and have got this. This seems to perfect. Theoretically it is. But after testing and comparing with the real function f, it was clear. This cannot be true.
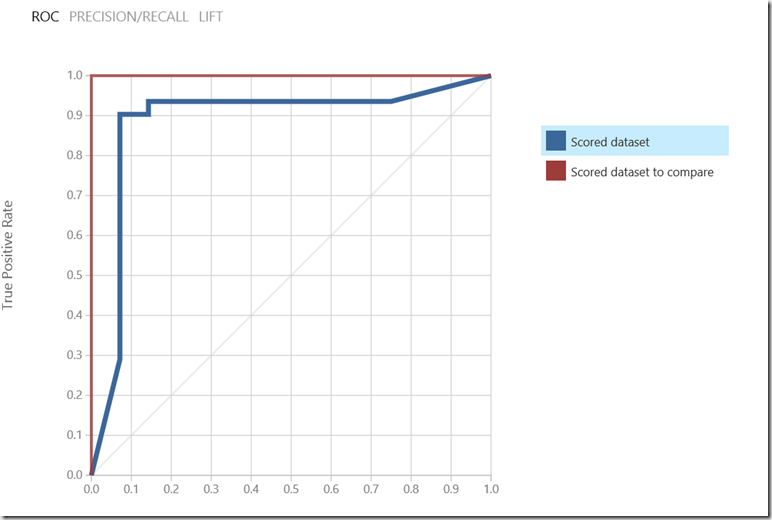
3000, 0.5, 3000
Lesion learned, increasing number of samples in data source by copying the data is not good idea. Interestingly, curve shown above looks perfect, but result discovered by testing is very bad.
What now?
Because, my experiment didn’t succeeded, I need to try something else. The best solution would be to somehow simplify the data. So I take the sum of 3 variables and use it now as input. I expect that reducing of input scalars (features) is easier for algorithm to learn.
a,b,c,outa+b-c
1,37
1,27
0,3
1,76
0,73
1,18
0,12
0,13
0,14
1,28
1,19
I simply removed first 3 features from previous data source. First column is the result which we need to predict and second one is a feature. I will try again with Two-Class-Boosted-Decision-Tree.
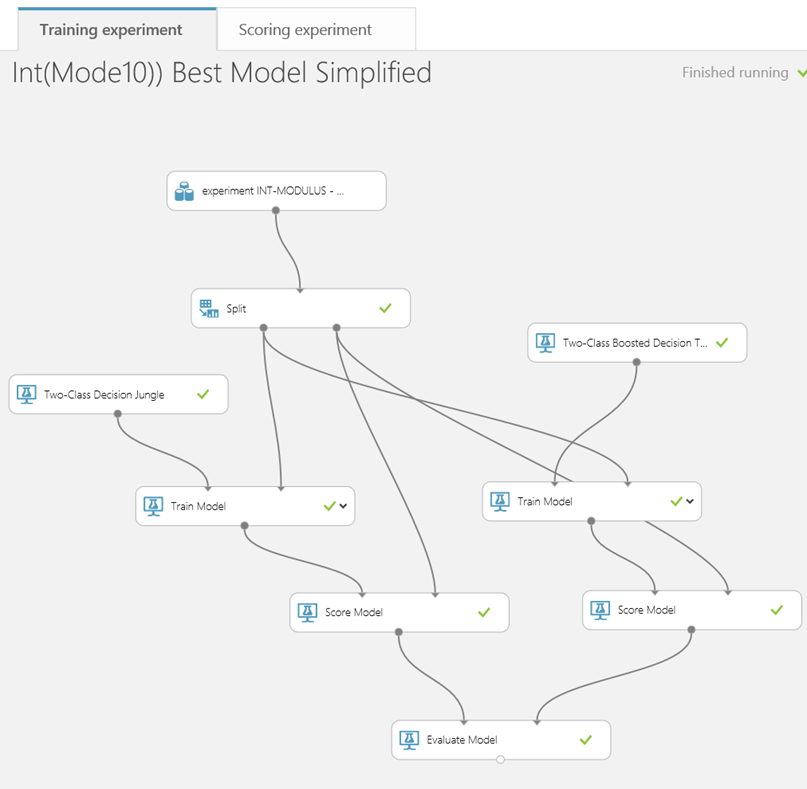
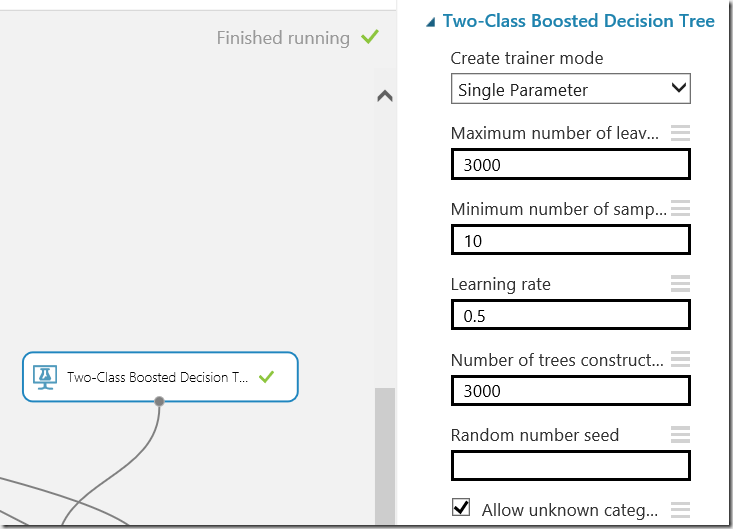
But, I will tune some of algorithm parameters as shown on the picture below.
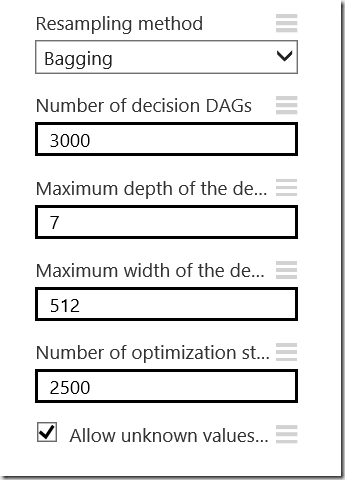
I started the experiment again and with following parameters tuned on “Jungle” algorithm.
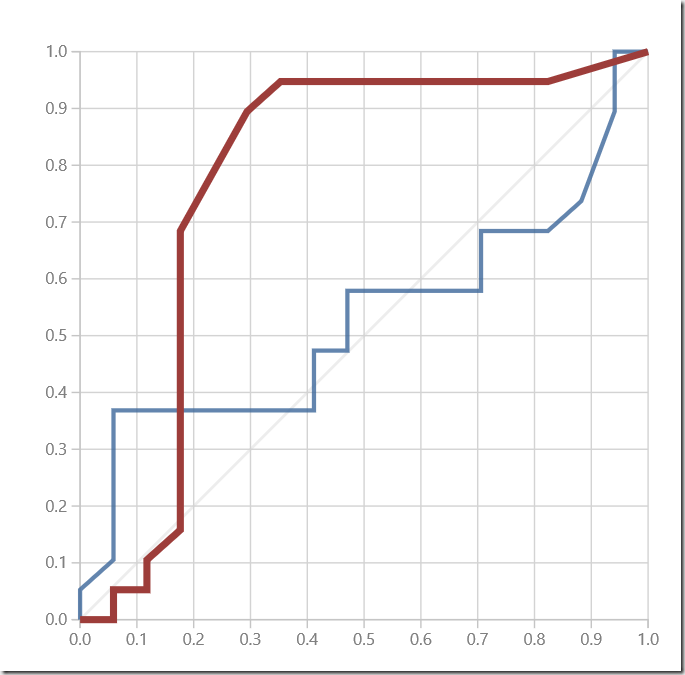
After the run is finished, we can notice that the model on left (‘Jungle’) shows worst accuracy than “Boosted Decision”.
I was not satisfied with result and tried over and over again different variations of parameters in boot models. The I decided to automate this process by using of “Sweep Parameters” module. This module automatically combine different parameters of algorithm and tries to find the best match.
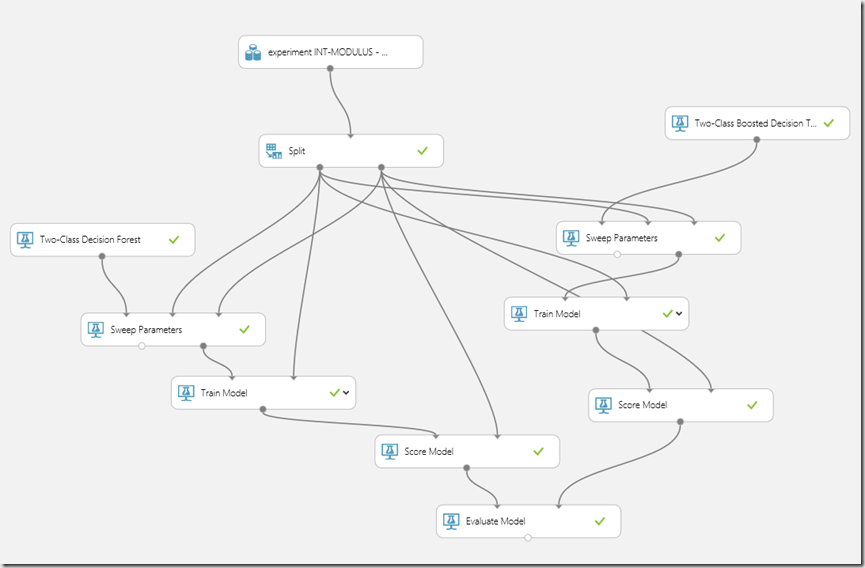
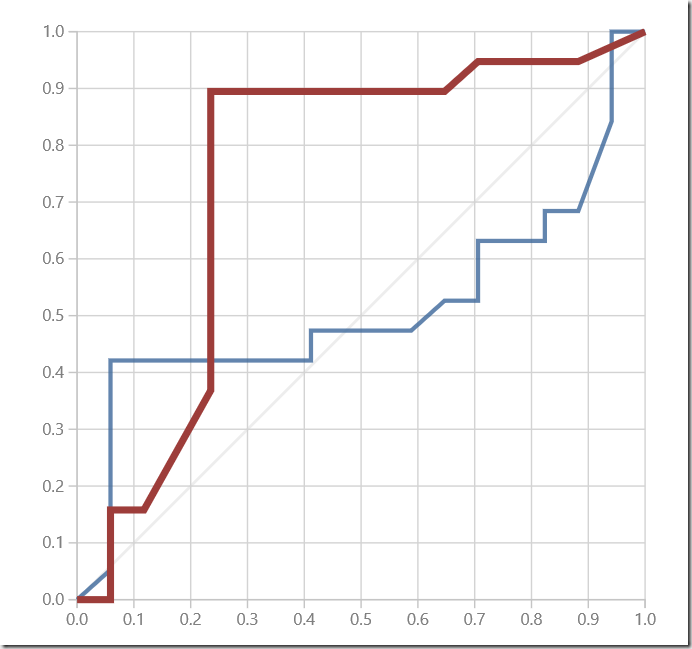
At the end I got slightly better result for Two-Class Decision Forest, with accuracy of 0.75.
Recap
I started with some data source with 3 features and tried few algorithms with different parameters. Then I figured out that result was not satisfying. After all I reduced number of features. In this case I could do that, because result was calculated from their sum directly. Then I taken the same algorithm from beginning of my experiment. After some tuning of parameters I got finally accuracy of 0.779. This accuracy is not high, but not very bad. The I seeped parameters automatically and found maximal accuracy of 0.75 by trying different algorithms.
The goal of this post was necessary to find the best algorithm for known problem. The idea was to start experimentally looking for solution by trying different modules and by variation of their parameters. I found that this kind of problem cannot be solved with algorithms which I have in ML library. But the good thin is I didn’t spend months or even years for that.
Posted
May 19 2015, 06:16 AM
by
Damir Dobric