After installation of Windows 10 IoT Core for Raspberry Pi2 ( see picture below) Windows IoT Watcher

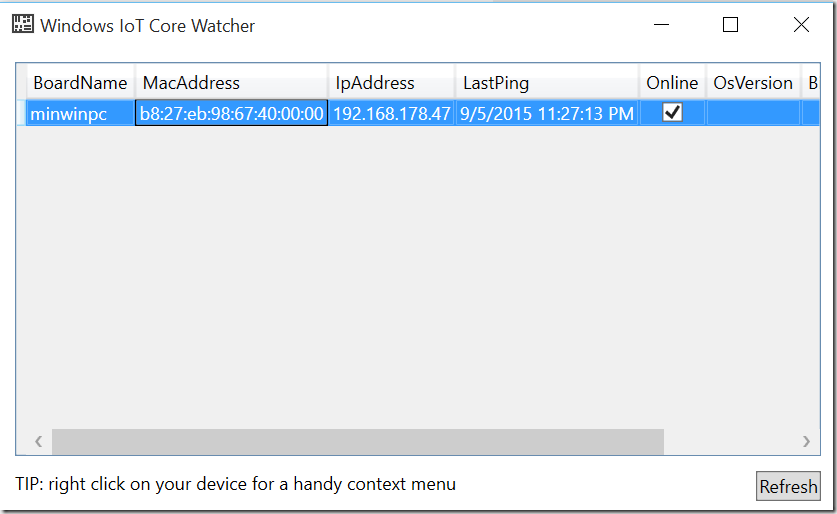
After you start the machine the watcher will automatically popup following window. That window will enlist all devices which are running Windows IoT Core operative system. The picture below shows my PI2.
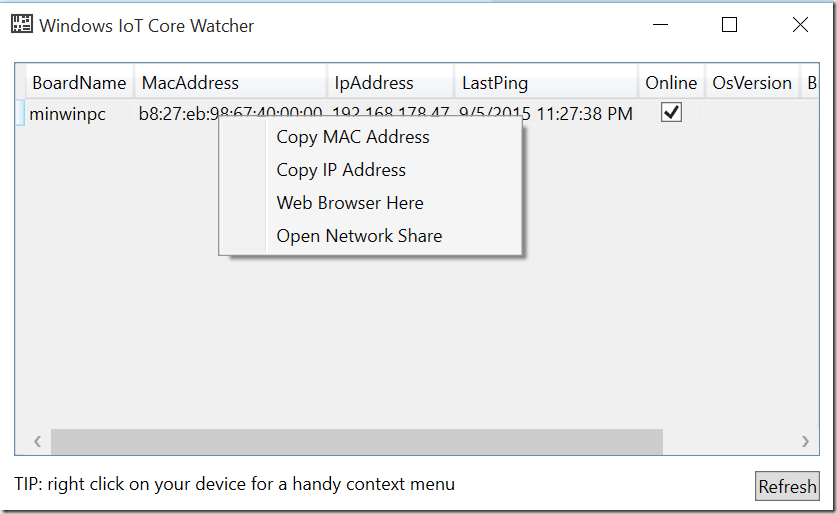
If you want to enter the management mode, press mouse click on selected device and select “Web Browser Here”.
Home
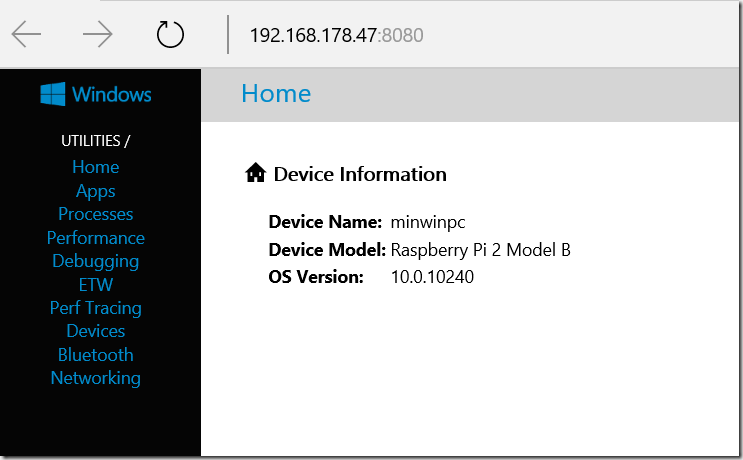
After you navigated to selected option, following home-page will appear. It contains the name of device, model and the OS version number.
Apps
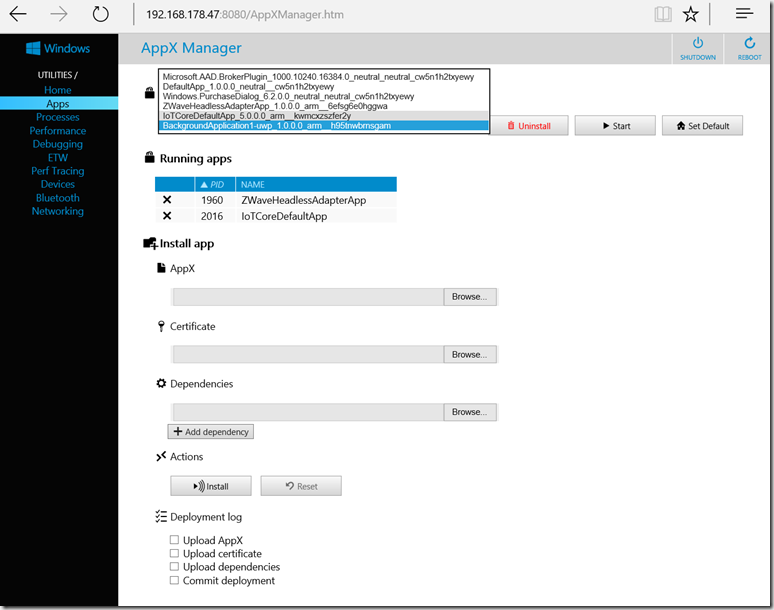
If you select next menu “Apps” you will be navigated to following page. On that page you can view, start, deploy and uninstall already installed applications. First five applications in the list are by default deployed with the flashing of device. The last one (selected one) is my test application.
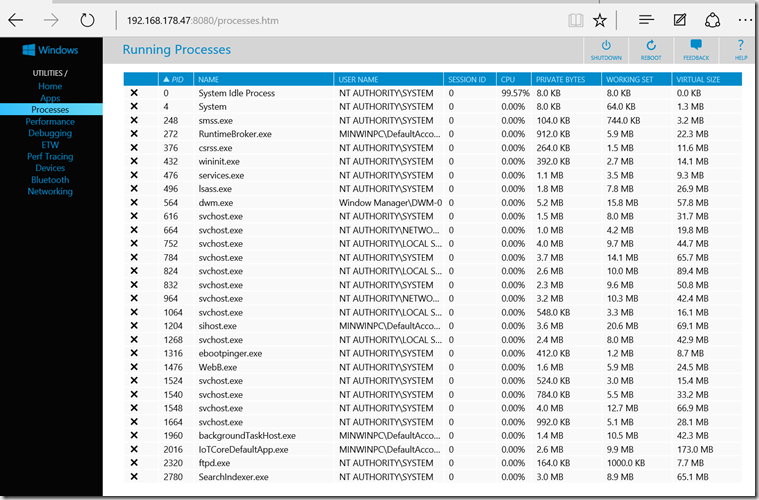
Processes
This menu options enlists all currently running processes on device. This operation is equivalent to executing of command TLIST in PowerShell remote mode.
Performance
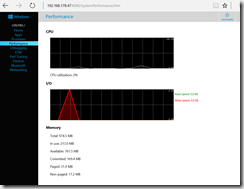
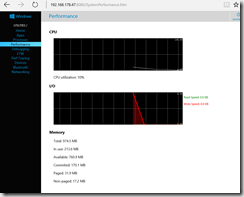
By clicking on this menu your browser will open the WebSocket to device, which will continuously stream back the performance data from device to browser.
Debugging
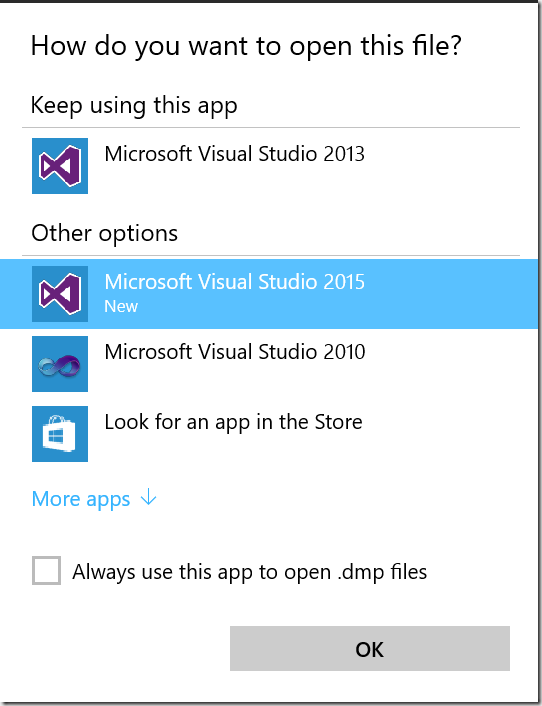
This view shows all running processes and their dump files. BY clicking on one dump-file, file will be downloaded (see open button on picture below)
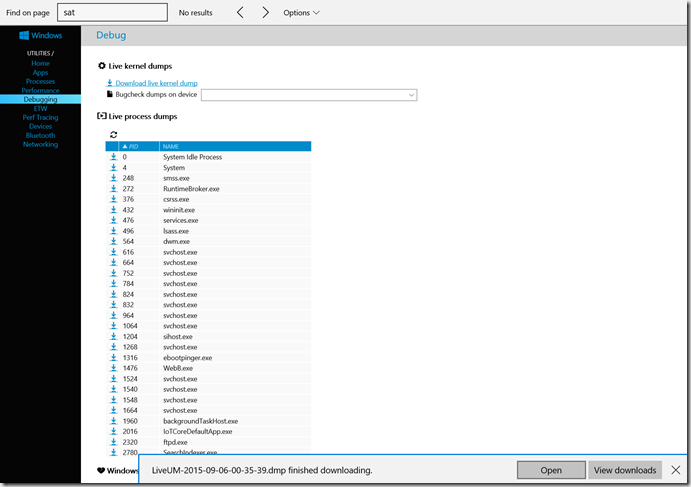
and you will be asked to chose the Visual Studio for debugging.
Etw
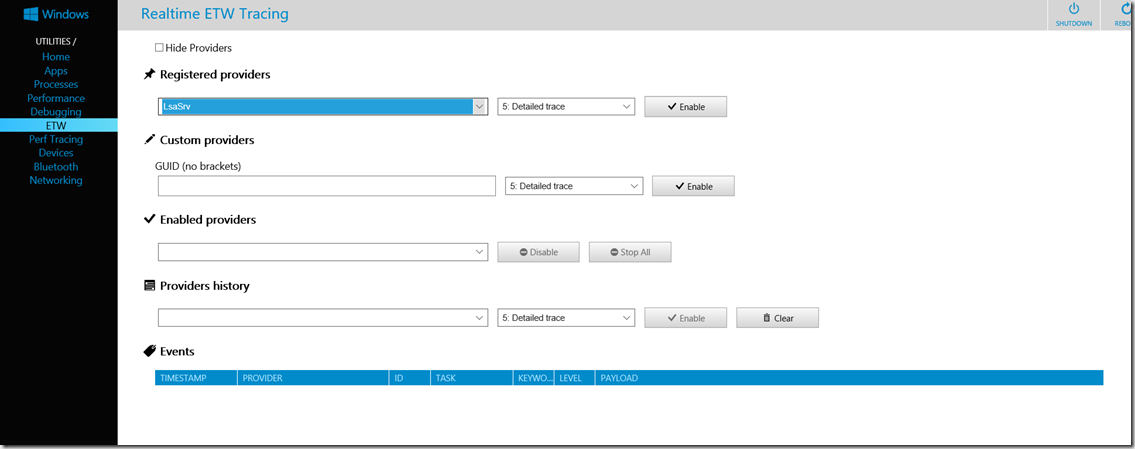
To enable Event Tracing for Windows you should enable wanted ETW providers. After provider is enabled, traced events will appear under events on the bottom of the view.
Devices
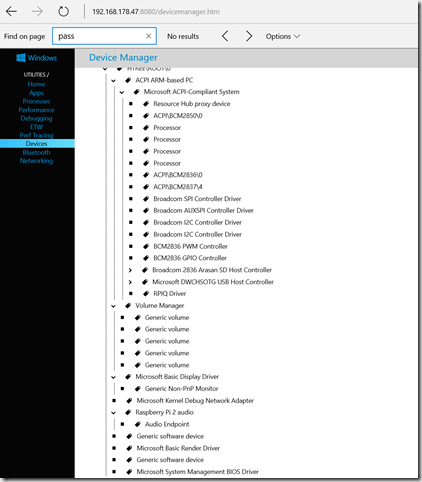
In this view you can take a look on installed devices (drivers)
Posted
Sep 15 2015, 06:23 AM
by
Damir Dobric